Astronomical transients have always been of special interest - the radio astronomy Vela pulsar observations searching for 'glitches' were motivated by this. Now activities have migrated over to optical astronomy and that interest in transients remain.
A subscription (free) to email alerts from the Transient Name Server (TNS) was made and alerts come in this format in an email...
The following new transient/s were reported on during the last day:
2024aazu RA=18:55:37.530, DEC=+01:30:48.46, Discovery date=2024-11-05 01:22:04.800, Discovery mag=14.42 ABMag, Filter: G - Gaia, Reporter: S.T. Hodgkin, E. Breedt, A. Delgado, D.L. Harrison, M. van Leeuwen, G. Rixon, T. Wevers, A. Yoldas ..., Reporting group: GaiaAlerts, Data source group: GaiaAlerts
2024aazw RA=20:15:22.890, DEC=+36:30:45.47, Discovery date=2024-11-04 09:51:50.400, Discovery mag=14.44 ABMag, Filter: G - Gaia, Reporter: S.T. Hodgkin, E. Breedt, A. Delgado, D.L. Harrison, M. van Leeuwen, G. Rixon, T. Wevers, A. Yoldas ..., Reporting group: GaiaAlerts, Data source group: GaiaAlerts
2024aazx RA=07:03:57.730, DEC=-02:12:37.22, Discovery date=2024-11-04 10:29:16.800, Discovery mag=13.3 ABMag, Filter: G - Gaia, Reporter: S.T. Hodgkin, E. Breedt, A. Delgado, D.L. Harrison, M. van Leeuwen, G. Rixon, T. Wevers, A. Yoldas ..., Reporting group: GaiaAlerts, Data source group: GaiaAlerts
The alert comes with the transient's ID, RA/DEC coordinates, discovery time, discovery magnitude, followed by other information.
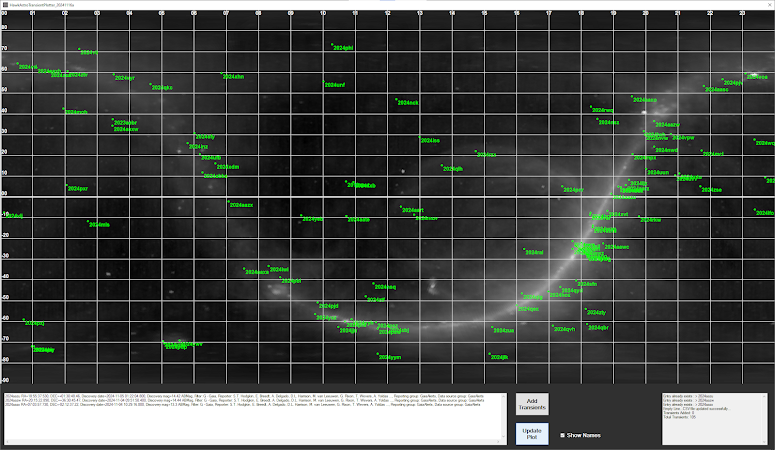
Curiosity about the distribution of transients provided the motivation to code a rough plotting application (C# Windows GUI) which would accept a cut-and-paste of the transient/s information lines and parse them into names and RA/DEC coordinates. The application then plots them on a RA/DEC graph which has a Hydrogen Line image as the background (which provides a guide to the position of the Milky Way).
As new transient alerts arrive they can be added to the list and the plot updated to show the new entries.
An example result is shown below...
 |
| Typical Plot (~100 transients) with Names Shown |
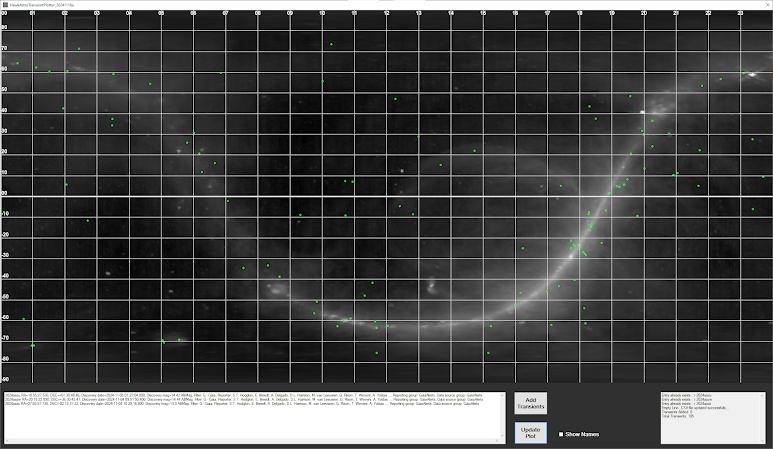
As can be seen as the number of transients increase there is confusion due to the names overlapping. An option to only plot the points is provided as shown below...
 |
| Typical Plot Without Names |