Sunday, November 17, 2024

Transient Plotter...

 Astronomical transients have always been of special interest - the radio astronomy Vela pulsar observations searching for 'glitches' were motivated by this. Now activities have migrated over to optical astronomy and that interest in transients remain.

A subscription (free) to email alerts from the Transient Name Server (TNS) was made and alerts come in this format in an email...

The following new transient/s were reported on during the last day:

2024aazu RA=18:55:37.530, DEC=+01:30:48.46, Discovery date=2024-11-05 01:22:04.800, Discovery mag=14.42 ABMag, Filter: G - Gaia, Reporter: S.T. Hodgkin, E. Breedt, A. Delgado, D.L. Harrison, M. van Leeuwen, G. Rixon, T. Wevers, A. Yoldas ..., Reporting group: GaiaAlerts, Data source group: GaiaAlerts

2024aazw RA=20:15:22.890, DEC=+36:30:45.47, Discovery date=2024-11-04 09:51:50.400, Discovery mag=14.44 ABMag, Filter: G - Gaia, Reporter: S.T. Hodgkin, E. Breedt, A. Delgado, D.L. Harrison, M. van Leeuwen, G. Rixon, T. Wevers, A. Yoldas ..., Reporting group: GaiaAlerts, Data source group: GaiaAlerts

2024aazx RA=07:03:57.730, DEC=-02:12:37.22, Discovery date=2024-11-04 10:29:16.800, Discovery mag=13.3 ABMag, Filter: G - Gaia, Reporter: S.T. Hodgkin, E. Breedt, A. Delgado, D.L. Harrison, M. van Leeuwen, G. Rixon, T. Wevers, A. Yoldas ..., Reporting group: GaiaAlerts, Data source group: GaiaAlerts

The alert comes with the transient's ID, RA/DEC coordinates, discovery time, discovery magnitude, followed by other information.

Curiosity about the distribution of transients provided the motivation to code a rough plotting application (C# Windows GUI) which would accept a cut-and-paste of the transient/s information lines and parse them into names and RA/DEC coordinates.  The application then plots them on a RA/DEC graph which has a Hydrogen Line image as the background (which provides a guide to the position of the Milky Way).

As new transient alerts arrive they can be added to the list and the plot updated to show the new entries.

An example result is shown below...
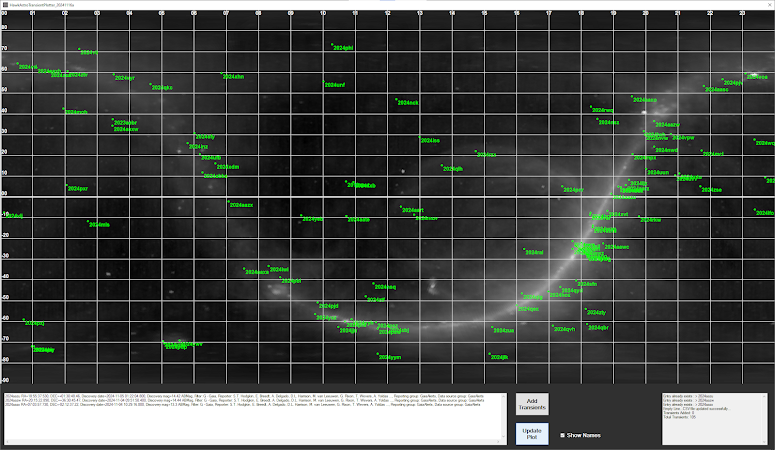
Typical Plot (~100 transients) with Names Shown

As can be seen as the number of transients increase there is confusion due to the names overlapping. An option to only plot the points is provided as shown below...
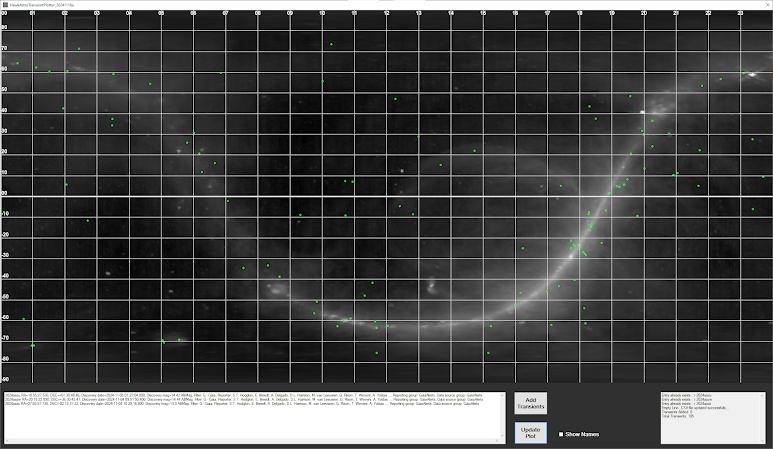
Typical Plot Without Names

As would be expected the highest density is near the Galactic Centre, but interestingly this density is - so far - not overwhelming higher than elsewhere.

It will be interesting to see how the plotting progresses over time as new transients are added.

Some extra functions may be added at a later date. For example - display only the newest object or objects for the purpose of seeing whether they can be seen in the Seestar S50.

NOTE: The TNS alerts come from telescopes which monitor a very large area of the sky. The likelihood of an amateur telescope with limited FOV discovering a transient are vanishingly small. Of course it is possible - but the likelihood of beating the professional observations is not great.

Friday, November 15, 2024

Observation Aid: SkyViewAltAz - Update #3

 When planning observation runs there is - unfortunately - a further factor that needs to be taken into account besides the visibility of targets through the various partial sky views available on the home block. That further factor is - of course - a clear sky.

While the application works well at its purpose of showing possible targets for the night, the presence of a clear sky was not included - which required looking up various websites.

The online website 'Clear Outside' provides a graphic which gives a forecast for the next couple of days in terms of skies suitable for observations. This graphic has been added to the 'SkyViewAltAz' application. Some re-arrangement of the GUI was also done to fit the graphic in.


Conveniently the 'Clear Outside' graphic is updated every hour and provides a prediction of cloud cover in general area of the home observatory.

Sunday, November 10, 2024

Observation Aid: SkyViewAltAz - Update #2

Some added functionality and a bug fix. The added functionality extends the search function to actually select the object - if found - and display its data. Checkboxes are provided for a full data search (on by default) and also to 'lock' the found object - to allow changing the date and time without updating the drop-down object list. Some re-arranging and resizing of the search function text boxes has also been done.

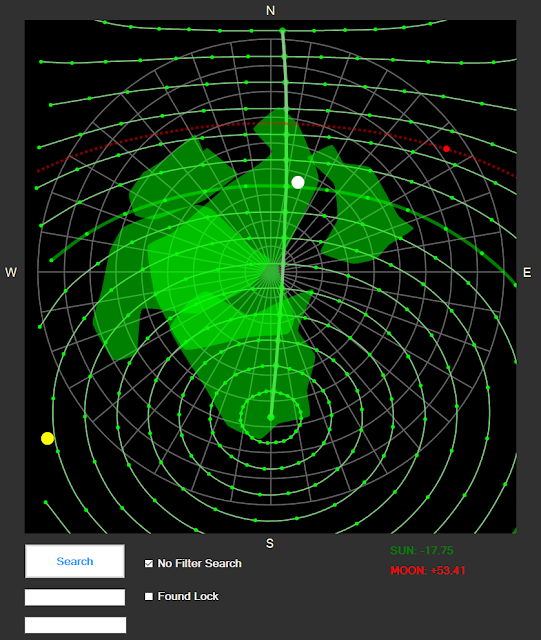
The position of the Sun and Moon are now calculated and representative filled circles (yellow for the Sun - white for the Moon) are plotted on the display. The current elevation of both of these objects is displayed (in green if below the horizon - red if above the horizon).

The bug fix prevents off-screen plotting (outside the PictureBox component) drawing spurious lines (see previous post image).  Instead of plotting the whole range at once, the plot points are tested to see if they are outside the PictureBox client rectangle and - if so - the segment up until that point is plotted.  Points are then continued to be scanned until a point is found inside the client rectangle and then the process repeats until all 'on-screen' points have been plotted. The granularity of the plotting points means that sometimes the plotted lines end before they have reached the edge of the PictureBox client rectangle - but this is considered the lesser of the two evils.

Another change is to the large image which is displayed on the right (nominally a screenshot from Stellarium) to indicate the size of the object w.r.t. the Seestar's FOV. As actual observations of an object are done, the object Stellarium screenshot will be replaced with an actual suitable Seestar observation image.

Apologies for the programming-oriented details. When the clouds stop coming over at night it will be back to pretty pictures...

Friday, November 1, 2024

Observation Aid: SkyViewAltAz - Update #1

 After evaluating the prototype version of SkyViewAltAz, a number of changes and additions were made. The intent is to provide a tool to assist in planning observation sessions - initially for use with the Seestar S50.

The current version provides time controls, selection of the various sky views from the home block (plotted on an Az/El grid), the path through the sky views for a selected object as well as various types of information (altitude/ azimuth, current field rotation, etc).

There are also filter options which limit which objects are populated in a drop down list, e.g., a range before and after LST, visibility in sky views - or visible from latitude 34 S (or no filters).

A thumbnail captured from the web (Wikipedia) is displayed to give an idea of the object itself - but of more use is a larger screenshot image (Stellarium) of the appearance of the object in the field of view (FOV) of the Seestar S50. This is very useful as images found on the web are the result from a wide variety of telescope FOVs - so, an object which looks like an interesting target judging from an image seen on the web might actually be from a large telescope with a very small FOV - but when viewed on a Seestar S50 may be just a dot in its much larger FOV.

SkyViewAzEl GUI (click on the image for a larger view)

All I need now is for the clouds to go away...

NOTE: the details provided here of SkyViewAzEl are informational only and primarily for my own documentation. Please don't ask for copies - I don't ever share my code as I have neither the time nor inclination to provide same - not to mention copyright issues (Wikipedia, Stellarium). To avoid being offended by a non-response - don't ask.

Wednesday, October 23, 2024

Observation Aid: SkyViewAltAz

As mentioned in a previous post - planning is fairly complex for observing on the home block. That post briefly described an application that was coded called "HawkAstroSkyView" - which mapped azimuth/altitude onto an RA/DEC grid. As explained, this greatly simplified planning - but provided a display dissimilar to the actual view when standing outside. To address this issue another application was coded called "SkyViewAltAz" where the altitude/azimuth sky 'patches' are mapped onto an alt/az 'dome'. The alt/az grid is overlayed with a RA/DEC grid. The alt/az grid 'dome' view more closely matches the view when standing outside - while the RA/DEC indicates the path through the sky view patches.  The RA/DEC is marked with dots spaced one hour apart. Note that all sky view patches are coloured green instead of individual colours and all can be viewed at one time (which allows determination whether the desired target object is visible in any sky view) - or individual views can be selected on their own to show detail of that particular sky view.

Buttons are provided to set date and time as for the previous application. This allows building observation plans for particular target objects by identifying the time of year where the object is visible overhead. For example - on this home block January-March is the best time of the year to start observing M42 around 8 pm in the evening. To observe now (end of September) the observation would need to start at around 2 am in the morning.
An enhancement which might be useful is to overlay a 'heatmap' of the degree of field rotation for the alt/az 'dome'. This may help identify pointings where the default exposure time can be increased from the nominal 10 seconds. That function may be added in the future.

Friday, October 11, 2024

Todmorden Pier - Variation...


The semi-permanent pier design is based on the Todmorden Pier. It comprises an assembly of concrete pavers and 'Besser' concrete blocks with furniture level adjusters. Construction adhesive for concrete was used to glue various parts to one another.

From the bottom up the components are...
  1. 600mm x 600mm x 25mm square concrete square.
  2. 400mm x 50mm round concrete paver (under shimmed at 3 points with thin rubber washers to roughly correct for slope of the underlying square paver).
    Note that these first 2 pavers are not affixed to each other.
  3. Two 'Besser' concrete blocks. The first block is glued to both the round paver below and the second block above it.
  4. A third 'Besser' block bolted to the second block below it. It is bolted instead of glued to allow the pier to be broken down into sections for easier transport - if needed.
  5. 400mm x 50mm round concrete paver. This round paver is glued to the third 'Besser' block below it.
  6. A set of three 8mm diameter furniture levellers are fitted at 120 degrees intervals. Holes (10mm) were drilled in the top 400mm x 50mm round concrete paver to accommodate the threaded portions of the levellers. There was found to be too much slop and the next iteration will use 8mm holes worked to just allow fitment of the 8mm diameter leveller shanks.
  7. Last 400mm x 50mm round concrete paver on top provides the mounting table for the smart telescopes (but also allows placement of the mount for a Celestron 4SE telescope).
Levelling of the top round paver is done by adjusting the top nut of each of the levellers whilst monitoring the level on the small smart telescope tripod. The levellers and top round paver are not glued and rely on gravity to keep them in place - the weight being sufficient for this. However, consideration will be given to whether to glue the bottom of the levellers to the underlying round paver. This would make assembling the top round paver simpler - but great care would needed to ensure proper alignment with the top round paver is achieved before the glue hardens.


This setup allows quick setting up of the smart telescopes and provides means to correct for any drift from the horizontal level due to ground movement.

After testing for a period of time, additional piers will be placed around strategic positions on the block. Each pier costs around $AUD 75.

The positions of those additional piers will be determined by mapping the sky view of candidate locations on the block in terms of points of azimuth and elevation. From those maps - with the help of custom coded applications - it can be determined whether a location warrants the construction of a pier of the design described above.

Friday, September 27, 2024

Observation Aid : HawkAstroSkyView

One of the disadvantages of our home block with regards to astrophotography is the tree coverage. There are just a handful of sites on the block which afford a clear sky view - and then only a small patch of the sky depending on the location. Trying to plan observing sessions is a hit-or-miss affair which involves wandering around trying to find a location where the target object is in view for the required time and duration of the observation.

To try and simplify this process an application was coded to plot an RA/DEC grid onto which is plotted objects - such as the Sun and Moon, the planets and a selection of deep sky objects (DSOs). Overlayed with that plot is colour-coded mapping of the azimuth/altitude views from a number of locations on the block.
Buttons are provided to adjust the date and time of the view and by adjusting these it's possible to plan when and where a target object may be observed. This simplified the planning process considerably !

The issue with this method of displaying the position of target objects is that the mapping of the azimuth/altitude windows on the sky produces a result which isn't easily visualised. The coloured areas so mapped don't agree with the actual view when standing outside and looking up.

Therefore - although this application greatly simplifies observation planning - it was decided to do the inverse where the parent grid is azimuth/altitude and an RA/DEC grid is mapped onto that. This produces a display more akin to the actual view as seen when standing outside. Should only take a week or two to code that.