Examination of the CDF in the graph below of a simulated astronomical image reveals that the shape of the CDF closely resembles the shape of typical non-linear 'stretch' curves used in astronomical image processing applications. It's an interesting exercise to use the CDF to remap the magnitude values according to the CDF.
In this example the magnitude values range from 0 - 100 (X-axis). Taking a magnitude value of 10 on the X-axis (10 % of full magnitude) and travelling up from 0 on the Y-axis - we cross the CDF at a PDF value of about 0.6 (right Y-axis). Scaling this PDF w.r.t. to the full magnitude of 100 gives a value of 60. So - using the CDF we have remapped a magnitude value of 10 to a value of 60. This has the effect of spreading the low level detail further up the magnitude scale lifting it up out of the dark. Of course, this is a crude example - but nonetheless illustrates the principle.
The effects of using this simple 'stretch' algorithm on three astronomical image types is shown below - where individual CDFs are generated for each of the three RGB channels. The underlying data hidden in the linear view are revealed. The flaws in this simple stretch method are discussed.
 |
| PDF and CDF of a Simulated Astronomical Image |
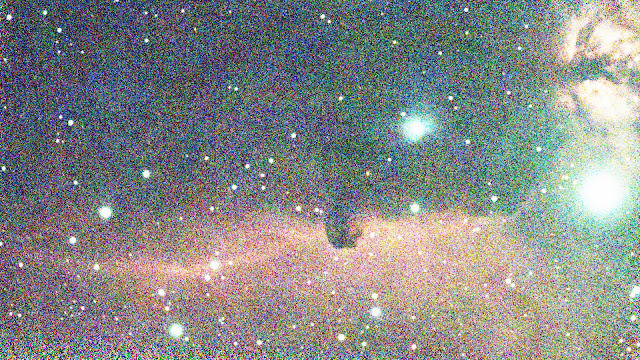
First, the Horsehead Nebula (IC 434) - a somewhat faint nebula near a very bright star...
 |
| IC434 (Horsehead Nebula) with Simple CDF Stretch |
The observation time was a short 12 minutes and so the nebula is faint and close to the noise floor. The faint details are brought up out of darkness - but at the expense of the bright parts - which are 'flattened' and devoid of detail. The stars appear bloated. The image also appears to be de-saturated in the bright parts.
The luminance histogram after this stretch indicates that using the CDF is a form of histogram equalisation - where values clustered down at the bottom of the magnitude scale are promoted up the scale. This is generally what is needed - but it is obvious that this simple method is not even close to ideal.
Second, NGC 4216 - a galaxy (with supernova) in a sparse star field with low nebulosity...
Once again the bright parts are 'flattened' and devoid of detail. The stars again appear bloated. The image also again appears to be de-saturated in the bright parts.
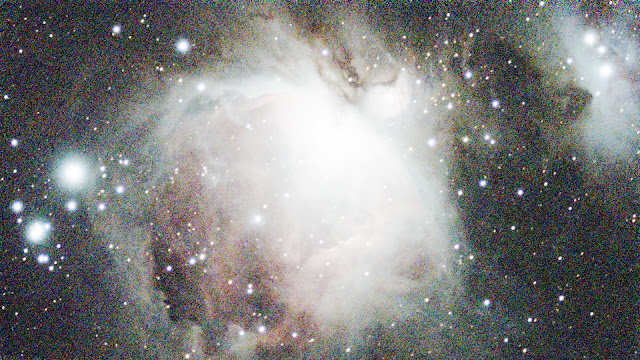
Third, the Orion nebula (M42) - a bright nebula with faint details covering a wide dynamic range...
 |
| Orion Nebula (M42) with Simple CDF Stretch |
Once again the bright parts are 'flattened' and devoid of detail. The stars again appear bloated. The image also again appears to be de-saturated in the bright parts. The bright parts of the nebula cover a significant portion of the image.
Due to the predominance of bright nebulosity in this data, the histogram is closer to what is required. However, the bright parts still have little detail and are desaturated.
Another issue with this simple method is the that quantisation of the data is emphasised as shown in the histogram for just one colour - red.
The deviation from a more continuous curve is because when the re-mapping of values is done using the CDF, an increment of 1 in the input range resolves to many steps in the output range. For example, using the CDF of the M42 image results in an input value of 600 to be re-mapped to 4837, while an increment of 1 in the input value to 601 is re-mapped to 5648. That means output values in the range 4838 to 5647 are not possible. This is not good as effectively many bits of amplitude resolution have been lost in the majority of the amplitude range - losing subtle detail.
Ways of reducing these flaws need to be found - if possible...


